Solved Examples and Worksheet for Graphing Linear Equations and Inequalities
A. 4
B. 4
C.
D. 4
Step: 1
The boundary line of the half-plane is dashed if the inequality is < or > and solid if the inequality is ≤ or ≥.
Step: 2
For the inequalities 4x y x y x y
Step: 3
For the inequality 4x y
Correct Answer is : 4x y
A. 6
B. 6
C. 2
D. 2
Step: 1
The boundary line of the half-plane is dashed if the inequality is < or > and solid if the inequality is ≤ or ≥.
Step: 2
For the inequalities 6x y x y x y
Step: 3
For the inequality 2x y
Correct Answer is : 2x y
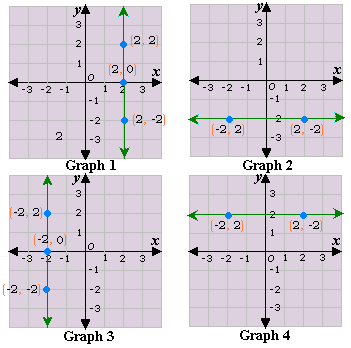
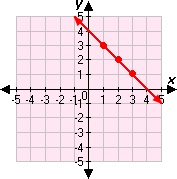
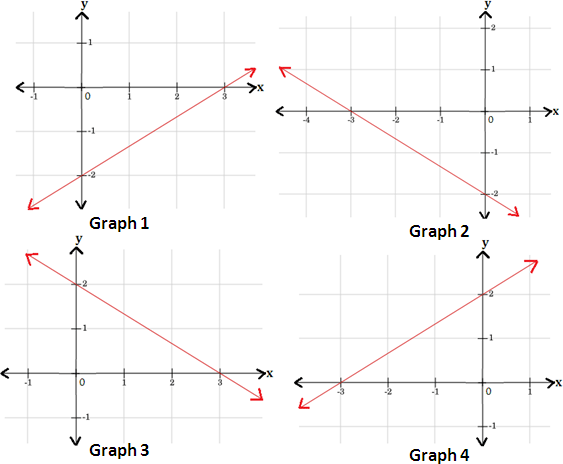
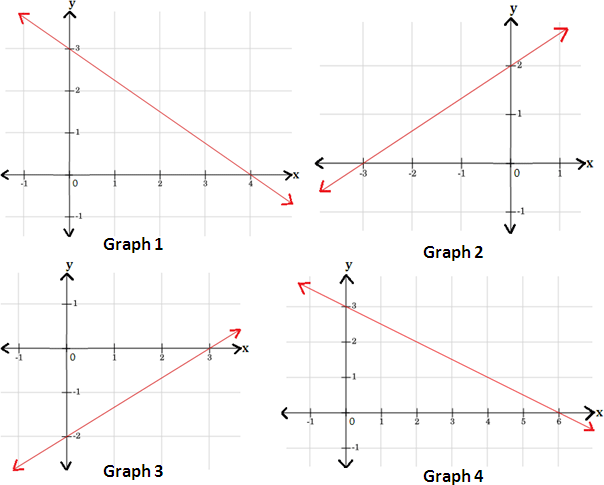
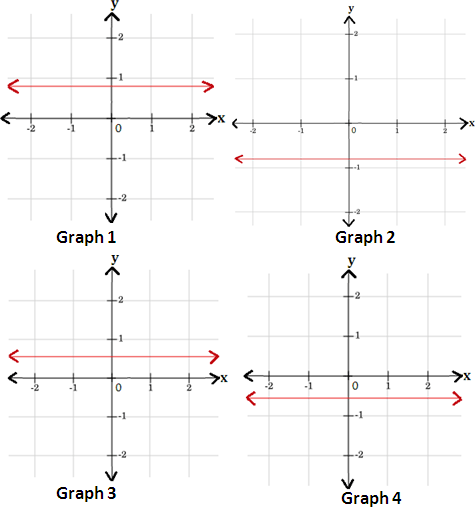
A. Graph 3
B. Graph 1
C. Graph 4
D. Graph 2
Step: 1
The x y
Step: 2
The graph of the equation x y
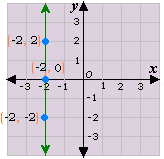
Step: 3
The above graph matches with the graph 3.
Correct Answer is : Graph 3
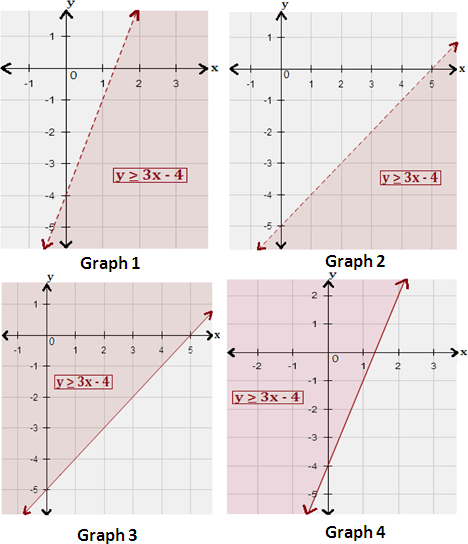
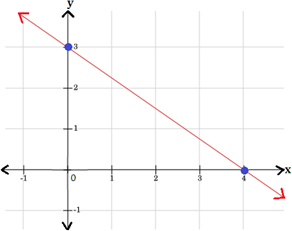
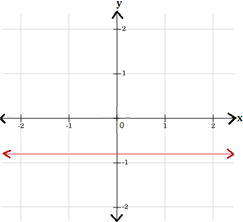
A. Graph 3
B. Graph 4
C. Graph 1
D. Graph 2
Step: 1
- y x
[Original equation.]
Step: 2
[Apply the slope-intercept form, y m x c
Step: 3
Choose values for x
Step: 4
Plot the points on a graph.
Step: 5
The above graph matches with the Graph 4.
Step: 6
So, Graph 4 is the correct choice.
Correct Answer is : Graph 4
A. Graph 1
B. Graph 4
C. Graph 2
D. Graph 3
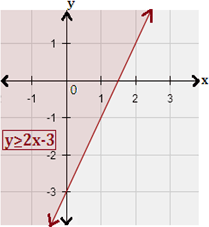
Step: 1
[Write the corresponding equation of the given inequality.]
Step: 2
The equation is in slope-intercept form y = mx + b
Step: 3
Graph the corresponding equation using the slope and y-intercept. As the inequality involves '≥', use a solid line.
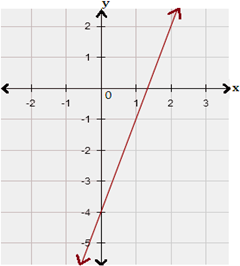
Step: 4
Test a point, which is not on the boundary line. Test (0, 0) in the inequality.
y x
[True.]
Step: 5
Since the inequality is true for (0, 0), shade the region that contains (0, 0).
Step: 6
Therefore, graph 4 represents the inequality y x
Correct Answer is : Graph 4
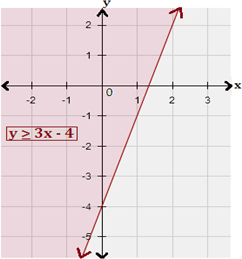
A. Graph 1
B. Graph 3
C. Graph 2
D. Graph 4
Step: 1
[Write the corresponding equation of the given inequality.]
Step: 2
The equation is in slope-intercept form y = mx + b m b y
Step: 3
Graph the corresponding equation using the slope and y-intercept. As the inequality involves '<', use a dashed line.
Step: 4
Test a point, which is not on the boundary line. Test (0, 0) in the inequality.
Step: 5
[True.]
Step: 6
Since the inequality is true for (0, 0), shade the region that contains (0, 0).
Step: 7
Therefore, graph 2 represents the inequality y x
Correct Answer is : Graph 2
A. Graph 1
B. Graph 4
C. Graph 3
D. Graph 2
Step: 1
[Write the corresponding equation of the given inequality.]
Step: 2
The equation is in slope-intercept form y = mx + b m b y
Step: 3
Graph the corresponding equation using the slope and y
Step: 4
Test a point, which is not on the boundary line. Test (0, 0) in the inequality.
Step: 5
[True.]
Step: 6
Since the inequality is true for (0, 0), shade the region that contains (0, 0).
Step: 7
Therefore, graph 3 represents the inequality y x
Correct Answer is : Graph 3
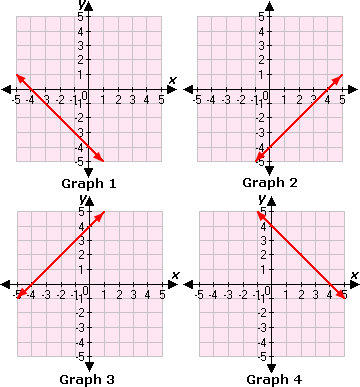
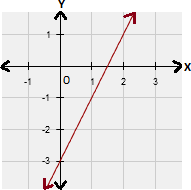
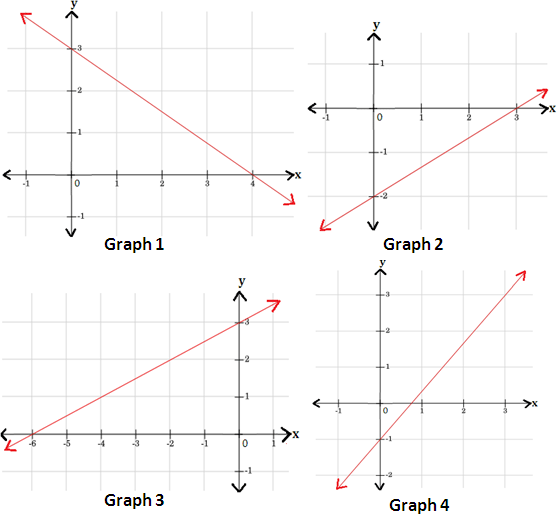
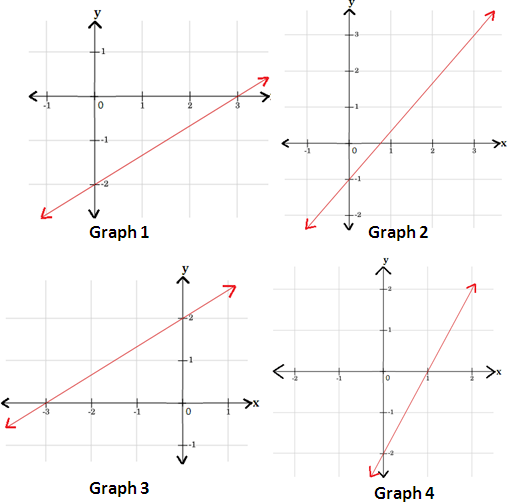
A. Graph 3
B. Graph 1
C. Graph 2
D. Graph 4
Step: 1
[Multiply by 2 on both sides of the equation.]
Step: 2
When x y 2 3
[Substitute x
Step: 3
When x y 2 3
[Substitute x
Step: 4
Thus, the points (0, -2) and (3, 0) are the solutions of the equation y 2 x 3
Step: 5
Draw a line passing through these points.
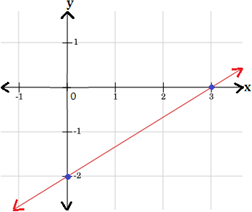
Step: 6
Therefore, graph 1, represents the equation y 2 x 3
Correct Answer is : Graph 1
A. Graph 3
B. Graph 4
C. Graph 1
D. Graph 2
Step: 1
Step: 2
When x y 3 4
[Substitute x
Step: 3
When x y 3 4
[Substitute x
Step: 4
Thus, the points (0, 3) and (4, 0) are the solutions of the equation y 3 4 x
Step: 5
Draw a line passing through these points.
Step: 6
Therefore, graph 1 represents the equation y 3 4 x
Correct Answer is : Graph 1
A. Graph 1
B. Graph 2
C. Graph 3
D. Graph 4
Step: 1
Step: 2
When x y 4 3
[Substitute x
Step: 3
When x y 4 3
[Substitute x
Step: 4
Thus, the points (0, - 1) and (3, 3) are the solution of the equation y 4 3 x
Step: 5
Draw a line passing through these points.
Step: 6
Therefore, graph 4, represents the equation y 4 3 x
Correct Answer is : Graph 4
A. Graph 4
B. Graph 2
C. Graph 3
D. Graph 1
Step: 1
[Simplify the equation.]
Step: 2
The y x
Step: 3
Thus, the graph of the equation y x
Step: 4
Therefore, graph 2 represents the equation y 4 5
Correct Answer is : Graph 2
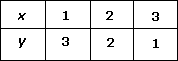
A. Graph 2
B. Graph 3
C. Graph 4
D. Graph 1
Step: 1
The x x
Step: 2
The y y
Step: 3
Plot the points (1, 0) and (0, -2) and draw a line through them.
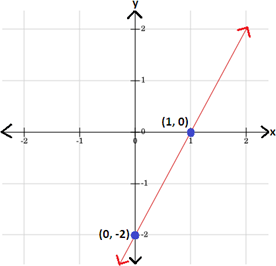
Step: 4
Therefore, graph 4 represents the graph of the equation whose x y
Correct Answer is : Graph 4
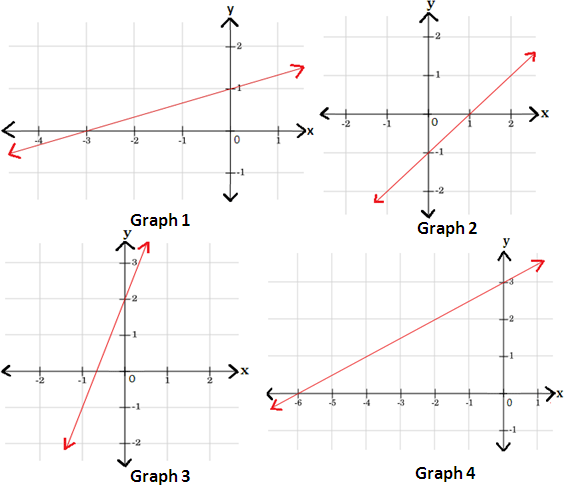
A. Graph 4
B. Graph 3
C. Graph 1
D. Graph 2
Step: 1
The x x
Step: 2
The y y
Step: 3
Plot the points (-3, 0) and (0, 1) and draw a line through them.
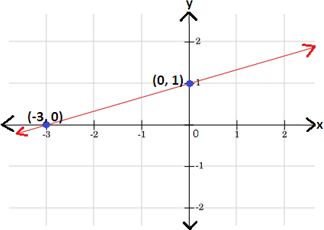
Step: 4
Therefore, graph 1 represents the graph of the equation whose x y
Correct Answer is : Graph 1
- Solving One-Step Linear Equations-Algebra1-Solved Examples
- Solving Two-Step Linear Equations-Algebra1-Solved Examples
- Solving One-Step Linear Inequalities-Algebra1-Solved Examples
- Solving and Graphing Absolute Value Equations-Algebra1-Solved Examples
- Solving and Graphing Absolute Value Inequalities-Algebra1-Solved Examples
- Identifying the Graph for the Table-Algebra1-Solved Examples
- Solving Systems of Equations using Elimination Method-Algebra1-Solved Examples
- Solving Systems of Equations using Substitution Method-Algebra1-Solved Examples
- Solving Systems of Equations Graphically-Algebra1-Solved Examples
- Graphing Systems of Equations and Inequalities-Algebra1-Solved Examples
- Solving Quadratic Equations By Completing Squares-Algebra1-Solved Examples
- Solving Quadratic Equations by Finding Square Roots-Algebra1-Solved Examples
- No real Solutions for Quadratic Equations-Algebra1-Solved Examples
- Solving Quadratic Equations Graphically-Algebra1-Solved Examples
- Solving Quadratic Linear Systems of Equations-Algebra1-Solved Examples
Related Worksheet
- Linear Equation