Solved Examples and Worksheet for Identifying Functions
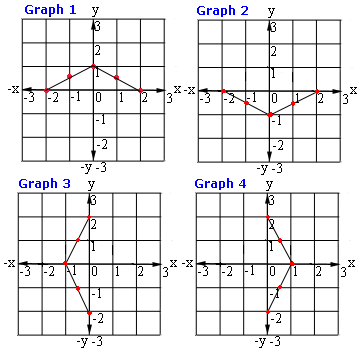
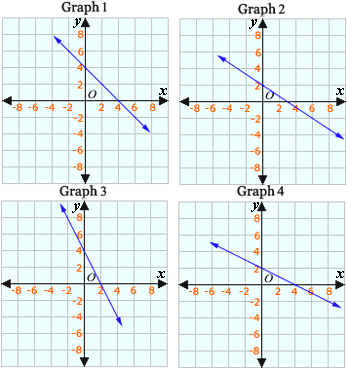
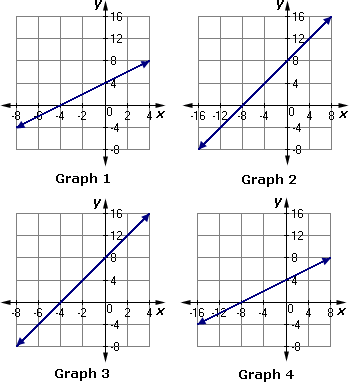
A. Graph 1
B. Graph 2
C. Graph 3
D. Graph 4
Step: 1
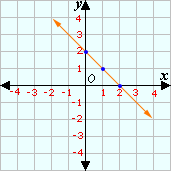
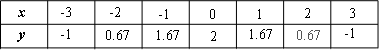
Make a table for different values of x
Step: 2
Draw a graph using the tabulated values as shown below.
Step: 3
So, Graph 1 represents the function y 1 2 x
Correct Answer is : Graph 1
A. Graph 1
B. Graph 2
C. Graph 3
D. Graph 4
Step: 1
Step: 2
3y x
[Multiply with 3 on both sides.]
Step: 3
Choose values for x
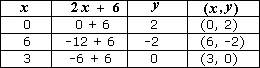
Step: 4
Plot the points on a graph.
Step: 5
The above graph matches with the graph in choice B.
Step: 6
So, choice B is the correct answer.
Correct Answer is : Graph 2
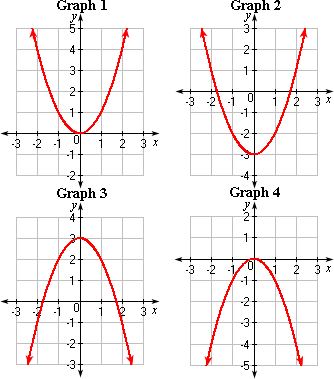
A. Graph 2
B. Graph 4
C. Graph 3
D. Graph 1
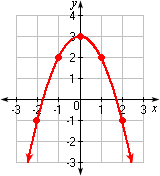
Step: 1
[Original quadratic function.]
Step: 2
[Comparing with y ax bx c
Step: 3
The x - b 2 a 0 2 ( - 1 3 )
Step: 4
The values of y x 2 3 x x
Step: 5
The graph 2 satisfies the above table.
Correct Answer is : Graph 2
A. Graph 2
B. Graph 1
C. Graph 3
D. Graph 4
Step: 1
[Original function.]
Step: 2
[Comparing with y ax bx c
Step: 3
The x - b 2 a - 0 2 ( - 1 )
Step: 4
The values of y x x x
Step: 5
Plot the points and join them with a smooth curve as shown.
Step: 6
The graph matches with Graph 3.
Correct Answer is : Graph 3
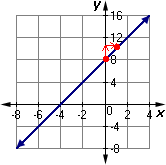
A.
B.
C.
D.
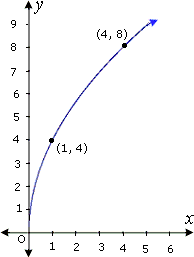
Step: 1
From the graph (0,0), (1,4), and (4,8) lies on the curve.
Step: 2
Substitute the points in the given equations and verify.
Step: 3
So,
[Substitute x y ( x )
Step: 4
So,
[Substitute x y ( x )
Step: 5
So,
[Substitute x y ( x )
Step: 6
[Substitute x y ( x )
Correct Answer is : y ( x )
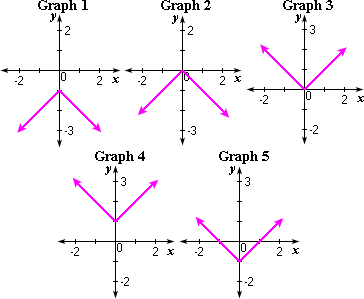
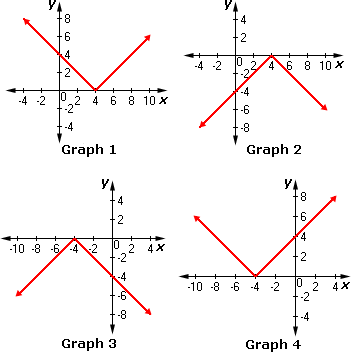
A. Graph 3
B. Graph 4
C. Graph 1 and Graph 2
D. Graph 1, Graph 2, and Graph 4
Step: 1
A step function is a special type of function whose graph is a series of line segments.
Step: 2
Among the graphs, Graph 3 has a series of line segments.
Step: 3
So, Graph 1, Graph 2 and Graph 4 does not represents a step function.
Correct Answer is : Graph 1, Graph 2, and Graph 4
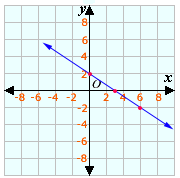
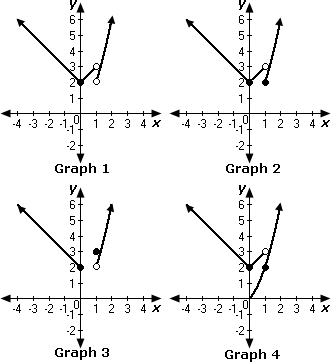
A.
B.
C.
D.
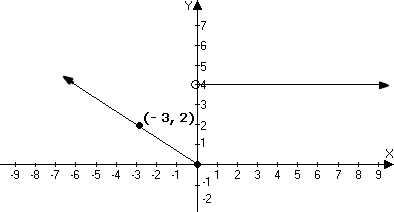
Step: 1
The given graph is in two pieces.
Step: 2
The slope of the line, left to the origin is - 2 3
Step: 3
The equation of the line in the slope intercept form is given by y m x b
Step: 4
Substituting the values for m 2 3 b
y 2 3 x
[The solid dot at the origin indicates y x
Step: 5
The slope of the line to the right of the origin is 0 and the y-intercept is 4.
Step: 6
Substitute the values of m b y m x b
y
[The open circle on the second piece indicates the graph begins when x
Step: 7
Therefore, the graph represents the function,
y 2 3 x x
y x
Correct Answer is : y 2 3 x x
y x
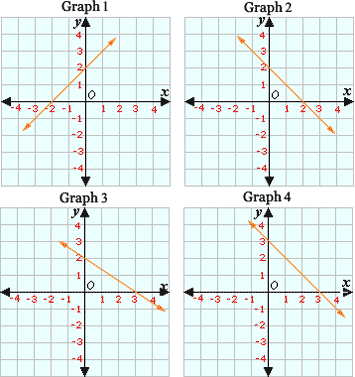
A. Graph 3
B. Graph 1
C. Graph 4
D. Graph 2
Step: 1
[Given equation.]
Step: 2
From the equation y x y
Step: 3
Plot the point (0, b b
Step: 4
Use the slope to locate a second point on line.
Step: 5
Step: 6
Draw a line through the two points.
Step: 7
The graph of the equation y x
Correct Answer is : Graph 3
A. Graph 3
B. Graph 1
C. Graph 4
D. Graph 2
Step: 1
Make a table of values that includes both positive and negative x
| - 3 | - 2 | - 1 | 0 | 1 | 2 | 3 | |
| - 7 | - 6 | - 5 | - 4 | - 3 | - 2 | - 1 |
Step: 2
Graph the ordered pairs in the table shown and connect the points with a smooth curve.
Step: 3
Then the graph obtained matches with Graph 2.
Step: 4
So, Graph 2 represents the equation y x
Correct Answer is : Graph 2
A. Graph 4
B. Graph 2
C. Graph 1
D. Graph 3
Step: 1
[Given.]
Step: 2
|x
Step: 3
When x
Step: 4
Step: 5
When x
Step: 6
So, we can observe that Graph 2 represents the given relation.
Correct Answer is : Graph 2
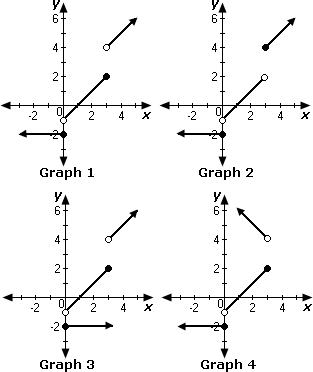
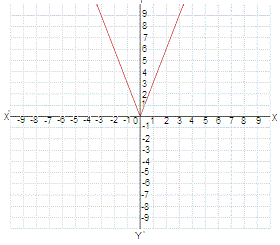
A. Graph 1
B. Graph 2
C. Graph 4
D. Graph 3
Step: 1
Identify the graph for the function shown.
f x x
x x
x x
[Given.]
Step: 2
When x
Step: 3
When 0 < x
Step: 4
When x
Step: 5
So, we can observe that the Graph 1 represents the given function.
Correct Answer is : Graph 1
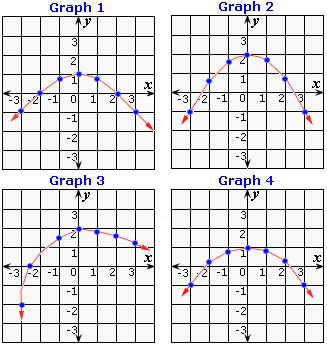
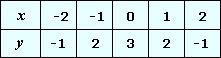
A.
B.
C.
D.
Step: 1
Make a table of values from the given graph that includes both positive and negative x
| - 3 | - 2 | - 1 | 1 | 2 | 3 | |
| 9 | 6 | 3 | 3 | 6 | 9 |
Step: 2
From the given choices, y x
Step: 3
So, the equation y x
Correct Answer is : y x
- Determining Whether a given Relation is a Function-Gr 8-Solved Examples
- Classifying Relations as Linear or Nonlinear-Gr 8-Solved Examples
- Graphing Linear Functions for a Given Domain-Gr 8-Solved Examples
- Graphing Linear Functions based on an x/y Table-Gr 8-Solved Examples
- Graphing Linear Equations-Gr 8-Solved Examples
- Finding the Rule of a Function Table-Gr 8-Solved Examples
- Solving Problems Using Rate of Change-Gr 8-Solved Examples
- Representing Exponential Functions Using Tables or Graphs-Gr 8-Solved Examples
Related Worksheet
- Absolute Value