Solved Examples and Worksheet for Graphing Linear Equations
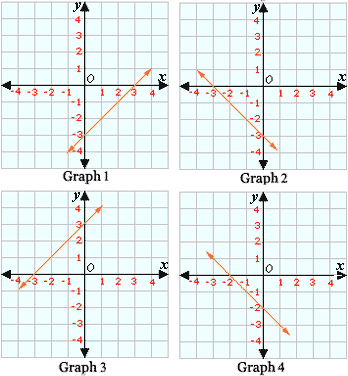
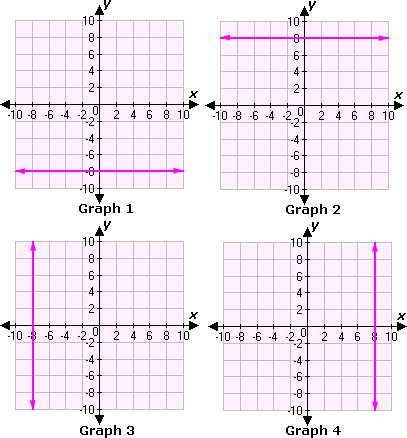
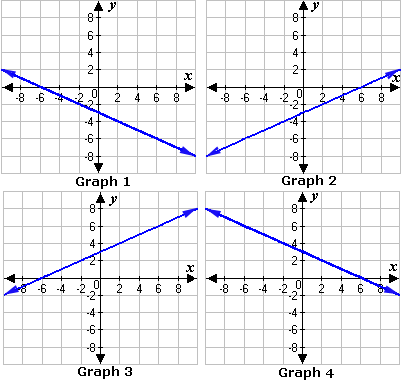
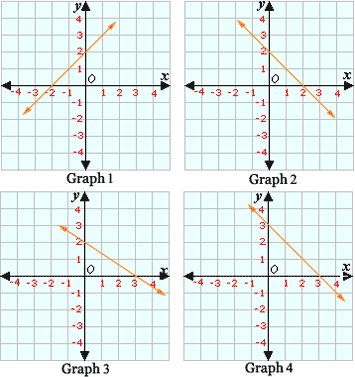
A. Graph 1
B. Graph 2
C. Graph 4
D. Graph 3
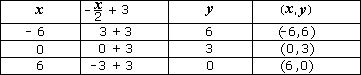
Step: 1
Step: 2
[Multiply with 3 on both sides.]
Step: 3
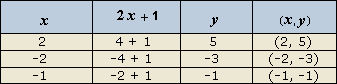
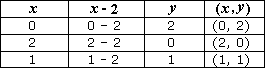
Choose values for x
Step: 4
Plot the points on a graph.
Step: 5
The above graph matches with the Graph 3.
Step: 6
So, Graph 3 represents the equation.
Correct Answer is : Graph 3
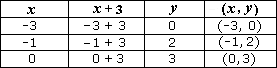
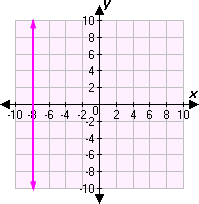
A. Graph 3
B. Graph 1
C. Graph 4
D. Graph 2
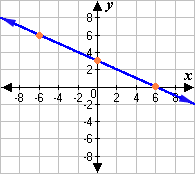
Step: 1
Calculate the values of y for some values of x as shown in the following table.
Step: 2
Plot the points on the graph
Step: 3
So, Graph 2 represents the equation y x
Correct Answer is : Graph 2

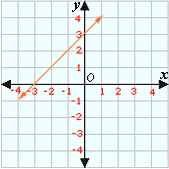
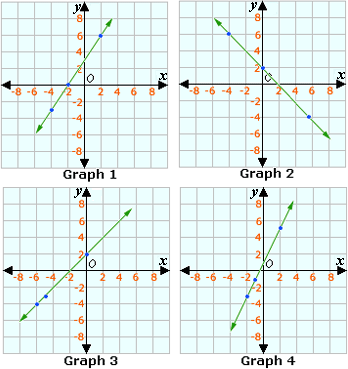
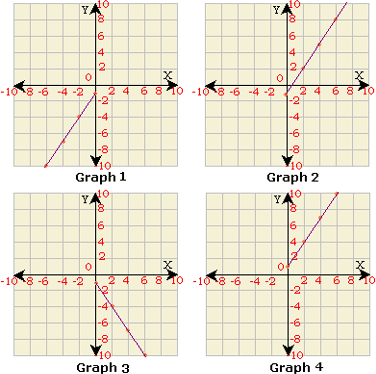
A. Graph 1
B. Graph 2
C. Graph 3
D. Graph 4
Step: 1
Step: 2
Choose values for x
Step: 3
Plot the points on a graph.
Step: 4
The above graph matches with the graph in choice B.
Step: 5
So, choice B is the correct answer.
Correct Answer is : Graph 2
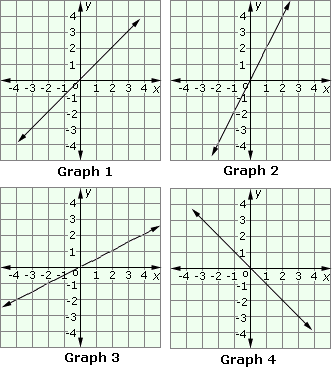
A. Graph 2
B. Graph 1
C. Graph 4
D. Graph 3
Step: 1
[Original equation.]
Step: 2
[Sustitute - 2 for x
Step: 3
[Sustitute - 1 for x
Step: 4
[Sustitute 0 for x
Step: 5
[Sustitute 1 for x
Step: 6
[Sustitute 2 for x
Step: 7
Plot the graph for the above values of x y
Step: 8
Among the graphs, Graph 1 suits the equation.
Correct Answer is : Graph 1
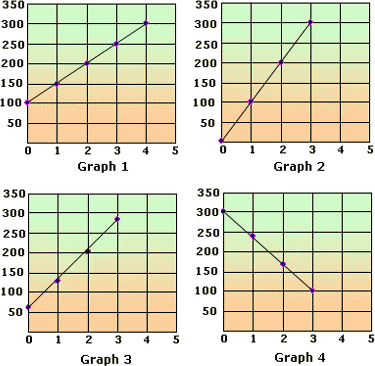
A. Graph 2
B. Graph 3
C. Graph 4
D. Graph 1
Step: 1
[Original equation.]
Step: 2
At x y
Step: 3
At x y
Step: 4
At x y
Step: 5
At x y
Step: 6
Represent the above data in tabular form, as shown below.
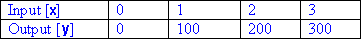
Step: 7
Among the choices, Graph 2 suits the result.
Correct Answer is : Graph 2
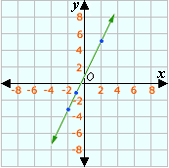
A. Graph 1
B. Graph 2
C. Graph 3
D. Graph 4
Step: 1
The x y
Step: 2
The graph of the equation x y
Step: 3
The above graph matches with the graph 3.
Correct Answer is : Graph 3
A. Graph 1
B. Graph 2
C. Graph 3
D. Graph 4
Step: 1
Solve the equation for y
- 2x y → y x
- 2
Step: 2
Calculate the values of y x
Step: 3
Plot the points on the graph.
Step: 4
So, Graph 4 represents the equation - 2x y
Correct Answer is : Graph 4
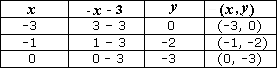
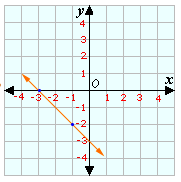
A. Graph 1
B. Graph 4
C. Graph 2
D. Graph 3
Step: 1
[Original equation.]
Step: 2
Solve the equation for y
x y → y x 2
Step: 3
Calculate the values of y x
Step: 4
Plot the points and draw the line by joining them.
Step: 5
Therefore Graph 4 represents the equation x y
Correct Answer is : Graph 4
A. Graph 1
B. Graph 2
C. Graph 3
D. Graph 4
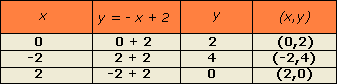
Step: 1
Solve the equation for y
-x y → y x
-
Step: 2
Choose values for x
Step: 3
Plot the points on a graph.
Step: 4
The above graph matches with the Graph 2.
Correct Answer is : Graph 2
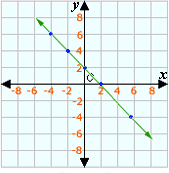
A. Graph 1
B. Graph 2
C. Graph 3
D. Graph 4
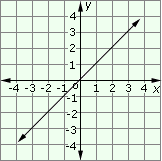
Step: 1
From the equation y 3 2 x y 3 2
Step: 2
Plot the point (0, 1).
[Since y
Step: 3
Move 3 units up from the point (0, 1). Then move 2 units right to plot the second point. Repeat the pattern to plot more points.
[Since slope = 3 2
Step: 4
Draw a line passing through these points.
Step: 5
The above graph matches with Graph 4.
Correct Answer is : Graph 4
- Determining Whether a given Relation is a Function-Gr 8-Solved Examples
- Classifying Relations as Linear or Nonlinear-Gr 8-Solved Examples
- Identifying Functions-Gr 8-Solved Examples
- Graphing Linear Functions for a Given Domain-Gr 8-Solved Examples
- Graphing Linear Functions based on an x/y Table-Gr 8-Solved Examples
- Finding the Rule of a Function Table-Gr 8-Solved Examples
- Solving Problems Using Rate of Change-Gr 8-Solved Examples
- Representing Exponential Functions Using Tables or Graphs-Gr 8-Solved Examples
Related Worksheet
- Intercept
- X-Intercept
- Y-Intercept