Solved Examples and Worksheet for Interpreting Bar Graphs
A. $750
B. $800
C. $650
D. $300
Step: 1
The height of the bar corresponding to year 1999 represents the amount deposited during the year.
Step: 2
From the graph, the amount of money deposited in 1999 is $300.
Correct Answer is : $300
A. 30
B. 10
C. 20
D. 40
Step: 1
The heights of the bars in the bar graph represent the number of apples sold by Edward during the past five days.
Step: 2
Note the height of the bar for Tuesday.
Step: 3
The height of the bar on Tuesday is 30.
Step: 4
Edward sold 30 apples on Tuesday.
Correct Answer is : 30
A. 30
B. 60
C. 50
D. 40
Step: 1
The heights of the bars in the bar graph represent the number of nickels, dimes and quarters in Bill's coin collection.
Step: 2
Note the height of the bar representing the number of nickels.
Step: 3
The height of the bar representing the number of nickels is 40.
Step: 4
Bill's collection contains 40 nickels.
Correct Answer is : 40
A. Arizona
B. Texas
C. Michigan
Step: 1
The height of each bar indicates the temperature in a particular state.
Step: 2
From the graph, we observe that the bar above Arizona is the tallest. So, among the three states, Arizona recorded the maximum temperature (more than 80oF).
Correct Answer is : Arizona
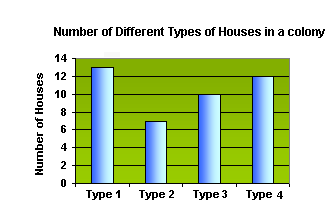
A. 10
B. 13
C. 7
D. 12
Step: 1
The height of each bar in the graph is a measure of the number of pens of the particular type.
Step: 2
The bar above Type 1 reaches 13 on the scale.
Step: 3
So, there are 13 pens of Type 1 in the box.
Correct Answer is : 13
A. 24
B. 23
C. 22
D. 20
Step: 1
The height of the bar above each subject represents the number of books present on that particular subject.
Step: 2
The bar above the subject Math reaches 24 on the scale.
Step: 3
So, there are 24 students who like Math best.
Correct Answer is : 24
A. 4
B. 6
C. 7
D. 5
Step: 1
The height of each bar indicates the number of Action Figures having the corresponding hair color.
Step: 2
The bar above orange reaches 4 on the scale.
Step: 3
So, the number of Action Figures having orange hair is 4.
Correct Answer is : 4
A. 4
B. 10
C. 8
D. 6
Step: 1
Maximum value is the highest number of fruits purchased by Susan.
Step: 2
The maximum value of the data = Number of Mangoes purchased by Susan = 8
[From the graph.]
Step: 3
The maximum value of the data is 8.
Correct Answer is : 8

A. Cheese and onion
B. Salt and Vinegar
C. Worcester sauce
D. Bacon
Step: 1
The height of each bar indicates the number of votes given for each Crisp flavor.
Step: 2
From the graph, we observe that the bar above Bacon is the smallest. So, among the four flavors, Bacon was voted the least.
Step: 3
Therefore, the correct answer is Bacon
Correct Answer is : Bacon
A. 10 minutes
B. 12 minutes
C. 7 minutes
D. 19 minutes
Step: 1
The height of each bar indicates the number of minutes each animal can hold its breath.
Step: 2
From the graph, we observe that the height of the bar above Dolphins is 12.
Step: 3
Therefore, a Dolphin can hold its breath for 12 minutes.
Correct Answer is : 12 minutes

A. Rabbit
B. Goldfish
C. Dog
D. Cat
Step: 1
The height of each bar indicates the number of votes given for each pet.
Step: 2
From the graph, we observe that the bar above Rabbit is the smallest. So, among the four pets, Rabbit was the least favorite pet.
Step: 3
Therefore, the correct answer is Rabbit.
Correct Answer is : Rabbit
A. 7
B. 10
C. 5
D. 9
Step: 1
The height of each bar indicates the number of votes given for each pet.
Step: 2
From the graph, we observe that the height of the bar above Goldfish is 9.
Step: 3
Therefore, 9 of them like Goldfish.
Correct Answer is : 9
- Telling Time to the nearest Minute-Gr 3-Solved Examples
- Elapsed Time-Gr 3-Solved Examples
- Measuring Length Using Ruler-Gr 3-Solved Examples
- Estimating Metric Units-Gr 3-Solved Examples
- Using Operations to Solve Problems Involving Volume and Mass-Gr 3-Solved Examples
- Perimeter of Polygons-Gr 3-Solved Examples
- Finding an Unknown Dimension of a Polygon-Gr 3-Solved Examples
- Finding Area of Rectangles by Tiling-Gr 3-Solved Examples
- Area of Plane Figures - Counting Unit Squares-Gr 3-Solved Examples
- Finding Areas of Rectilinear Figures-Gr 3-Solved Examples
- Solving Problems on Area of Rectangles-Gr 3-Solved Examples
- Representing Distributive Property Using Area Models-Gr 3-Solved Examples
- Rectangles with Same Area but Different Perimeters and Same Perimeter but Different Areas-Gr 3-Solved Examples
- Constructing Pictographs-Gr 3-Solved Examples
- Constructing Bar Graphs-Gr 3-Solved Examples