Graph
Definition Of Graph
Statistics: A graph is a picture that represents data in an organized manner
Algebra: A graph is a line or curve drawn on a number line or coordinate plane by joining the points represented by certain ordered pairs
More About Graph:
It's a pictorial representation of the data
Graph is the best tool to understand the data in an easy way
A graph is drawn in a grid
A graph is drawn between X and Y axes, where X axis is a horizontal line while Y axis is a vertical line
Examples of Graph
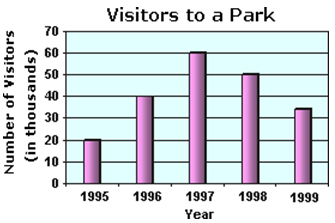
The figure shown below is an example of a statistical graph, called the bar graph that shows the number of people visited a park in different years.
Video Examples: Graph!
Solved Example on Graph
Ques : Identify the graph of the equation whose slope is - 3 and y-intercept is 6.
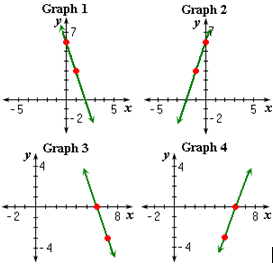
Choices:
A. Graph 2
B. Graph 3
C. Graph 1
D. Graph 4
Correct Answer: C
Solution:
Step 1: The equation of the line with slope - 3 and y-intercept 6 is y = - 3x + 6 which is 3x + y - 6 = 0
Step 2: So, The graph for the equation is Graph 1.
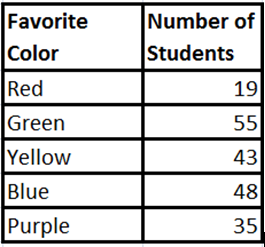
Ques: 200 hundred students were asked to name their favorite color. The result is shown in the table. Which of following is correct bar graph for the data given?
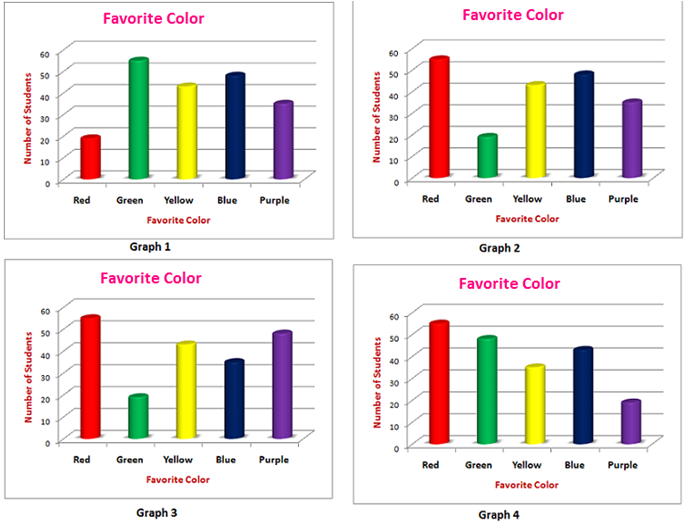
Choices:
A. Graph 1
B. Graph 3
C. Graph 4
D. Graph 2
Correct Answer: A
Solution:
Step 1: Observe the each number in the data and corresponding height of the bars
Step 2: The graph 1 is the correct representation of the data.
- Identifying-Functions-Gr-8