Related Links
Stacked Bar Graph
Definition Of Stacked Bar Graph
Stacked bar graph is a graph that is used to compare the parts to the whole. The bars in a stacked bar graph are divided into categories. Each bar represents a total.
Video Examples: Create a Stacked Column or Bar Chart
Example of Stacked Bar Graph
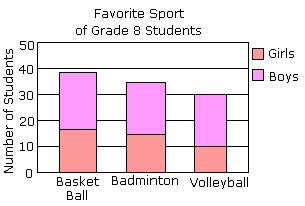
In the following example, each bar of the stacked bar graph is divided into two categories: girls and boys. Each of the three bars represents a whole. That is: about 38 students like Basket Ball, out of which 16 are girls.
Solved Example on Stacked Bar Graph
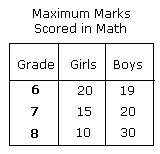
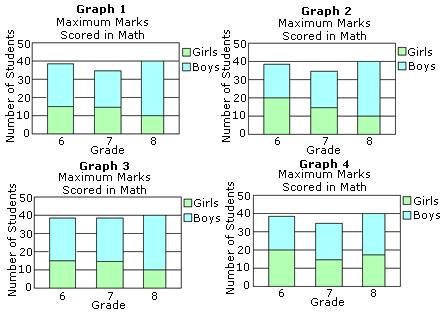
Ques: The table shows the maximum marks scored by grade 6, 7, and 8 students in math. Which of the following is the correct stacked bar graph for the table shown?
Choices:
A. Graph 1
B. Graph 2
C. Graph 3
D. Graph 4
Correct Answer: B
Solution:
Step 1: The values in Graph 2 matches with the values in the table given.
Step 2: So, Graph 2 is the correct stacked bar graph.
- Constructing-Bar-Graphs-Gr-3
- Interpreting-Bar-Graphs-Gr-3