Related Links
Scatter Plot
Definition Of Scatter Plot
A scatter plot is a graph made by plotting ordered pairs in a coordinate plane to show the correlation between two sets of data.
More About Scatter Plot
A scatter plot describes a positive trend if, as one set of values increases, the other set tends to increase.
A scatter plot describes a negative trend if, as one set of values increases, the other set tends to decrease.
A scatter plot shows no trend if the ordered pairs show no correlation.
Video Examples: Scatter Plots
Example of Scatter Plot
- The scatter plot shows the hours of study and test scores of 20 students.
As the number of hours of study increases, the marks scored tend to increase.
So, the scatter plot describes a positive trend.
Solved Example on Scatter Plot
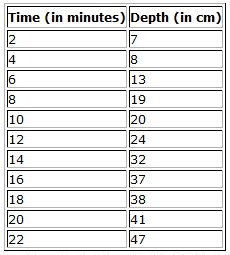
Ques: Emily measured the depth of water in a bathtub at two-minute intervals after the tap was turned on. The table shows her data. Make a scatter plot for the data.example of Scatter Plot
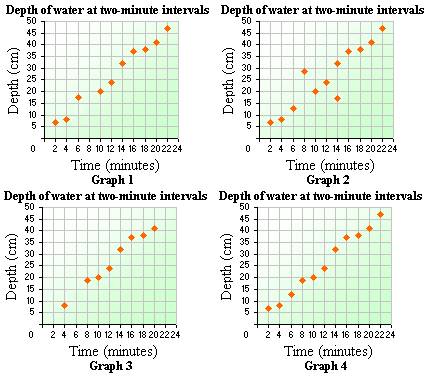
Choices:
A. Graph 2
B. Graph 1
C. Graph 3
D. Graph 4
Correct Answer: D
Solution:
Step 1: In a graph paper, represent the time in minutes along the x-axis and the depth of water in the bathtub along the y-axis.
Step 2: Plot the values in the table. The scatter plot would look like the one below.
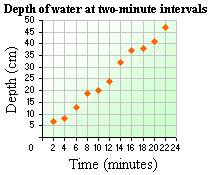
Step 3: Graph 4 matches the given data.