RANGE OF A FUNCTION
Definition Of Range Of A Function
The set of all output values or the y-values of a function or a relation is called the range of the function or the relation.
Examples of Range of a Function
The table shows some of the input and the corresponding output values of the function y = x + 1.
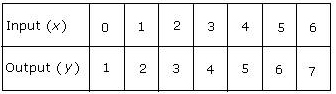
The range of the function is the set of all real numbers {. . . 1, 2, 3, 4, 5, 6, 7, . . . .}
Video Examples: Finding the Range of a Function
Solved Example on Range of a Function
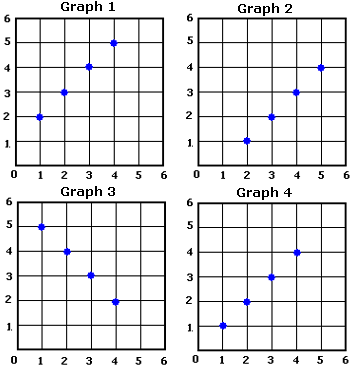
Ques: x = 1, 2, 3, 4 are some of the input values of the function y = 6 - x. Find the range of the function for the given input values and then plot the values on a coordinate plane as ordered pairs.
Choices:
A. Graph 1
B. Graph 2
C. Graph 3
D. Graph 4
Correct answer: C
Solution:
Step 1: The range of the function y = 6 - x, varies as the value of x changes.
Step 2: The output value y for x = 1 is: y = 6 - 1 = 5. [Substitute 1 for x and add.]
Step 3: The output value y for x = 2 is: y = 6 - 2 = 4. [Substitute 2 for x and add.]
Step 4: The output value y for x = 3 is: y = 6 - 3 = 3. [Substitute 3 for x and add.]
Step 5: The output value y for x = 4 is: y = 6 - 4 = 2. [Substitute 4 for x and add.]
Step 6: The ordered pairs are (1, 5), (2, 4), (3, 3), (4, 2).
Step 7: Plot the points on a coordinate plane.
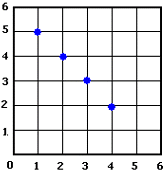
Step 8: So, Graph 3 is the graph that has the range of the function for the given input values plotted correctly.
Quick Summary
- The range consists of all possible y-values that result from the function.
- To find the range, consider the function's behavior over its entire domain.
- The range can be a set of discrete values or an interval of real numbers.
🍎 Teacher Insights
Use visual aids like graphs to illustrate the concept of range. Emphasize the difference between domain and range. Provide examples with various types of functions (linear, quadratic, etc.).🎓 Prerequisites
- Domain of a function
- Input and output values
- Coordinate plane
- Ordered pairs
Check Your Knowledge
Q1: What is the range of the function y = x + 1 for the input values x = {1, 2, 3, 4}?
Q2: If the input values for y = 6 - x are x = 1, 2, 3, 4, which ordered pair represents a point on the function?
Frequently Asked Questions
Q: How do I find the range of a function?
A: Consider all possible input values (domain) and determine the corresponding output values. Graphing the function can also help visualize the range.
Q: Can the range be empty?
A: Yes, if the function is not defined for any input value, the range is empty.