Divided Bar Graph
Definition Of Divided Bar Graph
In a Divided Bar Graph, a bar is divided into several segments to represent a set of quantities according to the different proportions of the total amount.
More About Divided Bar Graph
The concept of divided bar graph is similar to that of a pie chart.
A divided bar graph can be either horizontal or vertical.
Example of Divided Bar Graph
The following divided bar graph shows the percentage of men, women, and children who visited a zoological park out of the total people.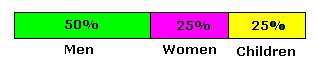
Green color indicates the percentage of men who visited the park; pink color indicates the percentage of women; and yellow color indicates the percentage of children.
Video Examples: Bar Graphs - MathHelp.com- Pre Algebra Help
Solved Example on Divided Bar Graph
Ques: The population of a city (in percent) is shown in the table.
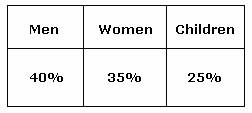
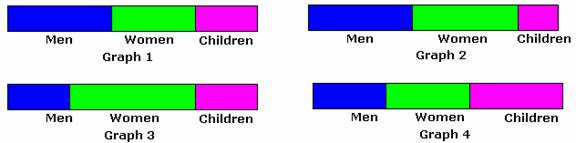
Which of the divided bar graphs represents the given table?
Choices:
A. Graph 1
B. Graph 2
C. Graph 3
D. Graph 4
Correct Answer: A
Solution:
Step 1: In Graph 1, the blue color shows the percentage of men approximately 40%; the green color shows the percentage of women approximately 35%; and the pink color shows the percentage of children approximately 25%.
Step 2: Hence, Graph 1 suitably represents the data given in the table.
- Constructing-Bar-Graphs-Gr-3
- Interpreting-Bar-Graphs-Gr-3