STACKED BAR GRAPH
Definition Of Stacked Bar Graph
Stacked bar graph is a graph that is used to compare the parts to the whole. The bars in a stacked bar graph are divided into categories. Each bar represents a total.
Video Examples: Create a Stacked Column or Bar Chart
Example of Stacked Bar Graph
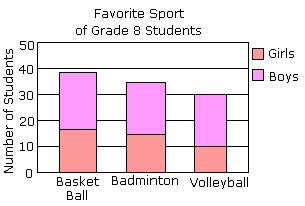
In the following example, each bar of the stacked bar graph is divided into two categories: girls and boys. Each of the three bars represents a whole. That is: about 38 students like Basket Ball, out of which 16 are girls.
Solved Example on Stacked Bar Graph
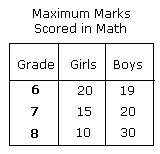
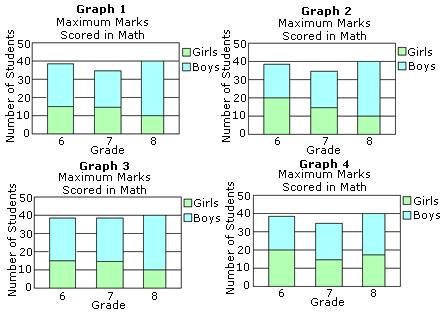
Ques: The table shows the maximum marks scored by grade 6, 7, and 8 students in math. Which of the following is the correct stacked bar graph for the table shown?
Choices:
A. Graph 1
B. Graph 2
C. Graph 3
D. Graph 4
Correct Answer: B
Solution:
Step 1: The values in Graph 2 matches with the values in the table given.
Step 2: So, Graph 2 is the correct stacked bar graph.
Quick Summary
- Compares parts to the whole.
- Each bar represents a total.
- Bars are divided into categories.
🍎 Teacher Insights
Use real-world examples to illustrate the concept, such as survey data or budget allocations. Encourage students to create their own stacked bar graphs from datasets they collect.🎓 Prerequisites
- Basic bar graphs
- Understanding of data categories
- Basic arithmetic
Check Your Knowledge
Q1: Which of the following is best represented by a stacked bar graph?
Q2: In a stacked bar graph showing the composition of a school's student body, what does the entire bar represent?
Frequently Asked Questions
Q: What is the purpose of a stacked bar graph?
A: To show how a whole is divided into different parts and to compare the relative sizes of those parts across different totals.
Q: How do you read a stacked bar graph?
A: Look at the overall height of each bar to compare totals, and the height of each segment within the bar to compare the contribution of each category.