PLOT
Definition Of Plot
Plotting is to place a point on a coordinate plane by using X and Y coordinates.
More About Plot
Plotting gives the exact position of a point on a coordinate grid.
Video Examples: GCSE Maths plotting graphs
Example of Plot
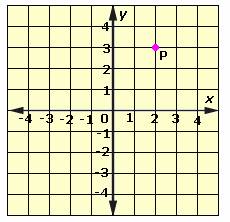
To plot a point (2, 3) on the coordinate plane, start from the origin and move 2 units to the right and then move 3 units up. Place the point as a dot. So, the pink point marked by P shows the plotting of (2, 3).
Solved Example on Plot
Ques: Which of the following points will be gained by plotting the coordinates (2, 1) in the graph?
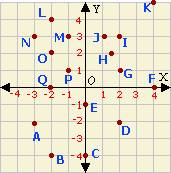
Choices:
A. G
B. L
C. H
D. J
Correct Answer: A
Solution:
Step 1: To plot (2, 1), move 2 units to the right and 1 unit up from the origin.
Step 2: The point with the coordinates (2, 1) is G.
Quick Summary
- Plotting gives the exact position of a point on a coordinate grid.
- To plot a point (x, y), start at the origin, move x units horizontally, and y units vertically.
🍎 Teacher Insights
Use graph paper to help students visualize the coordinate plane. Start with simple examples and gradually increase complexity.🎓 Prerequisites
- Understanding of number lines
- Basic arithmetic operations
- Concept of origin
Check Your Knowledge
Q1: Which point is represented by the coordinates (2, 1)?
Q2: To plot the point (3, -2), how do you move from the origin?
Frequently Asked Questions
Q: What is the origin?
A: The origin is the point (0, 0) on the coordinate plane, where the x-axis and y-axis intersect.
Q: How do I plot negative coordinates?
A: For negative x, move left from the origin. For negative y, move down from the origin.