PICTOGRAPH
Definition Of Pictograph
Pictograph is a way of representing statistical data using symbolic figures to match the frequencies of different kinds of data.
Examples of Pictograph
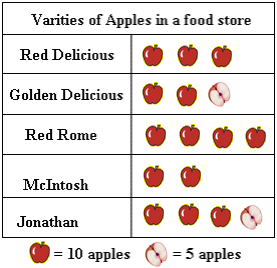
The pictograph shows the number of varieties of apples stored at a supermarket.
Video Examples: Excel Charts Pictograph
Solved Example on Pictograph
Ques: Use the pictograph to find the total number of apples stored in the supermarket.

Choices:
A. 150
B. 120
C. 140
D. 200
Correct Answer: A
Solution:
Step 1: The pictograph shows 14 full apples and 2 half apples.
Step 2: So, there are 140 + 10 = 150 apples stores in the supermarket.
Quick Summary
- Uses symbols to represent data.
- Each symbol represents a specific quantity.
- Easy to understand visually.
🍎 Teacher Insights
Use real-world examples to illustrate how pictographs are used. Encourage students to create their own pictographs using data they collect.🎓 Prerequisites
- Counting
- Basic arithmetic
- Understanding data
Check Your Knowledge
Q1: In a pictograph, if one apple represents 10 actual apples, and there are 5 apple symbols, how many apples are there?
Q2: A pictograph shows 3 full stars and 1 half star. If each star represents 4 items, how many total items are represented?
Frequently Asked Questions
Q: What if there's only half a symbol?
A: A half symbol usually represents half the value of a full symbol. Check the key or legend to be sure.
Q: Can I use any symbol for a pictograph?
A: Yes, but choose a symbol that is easy to understand and relevant to the data you are representing.