DOT PLOT
Definition Of Dot Plot
In a Dot Plot, a set of data is represented by using dots over a number line.
More About Dot Plot
The number of dots over the number line tells the value of the data points.
Examples of Dot Plot
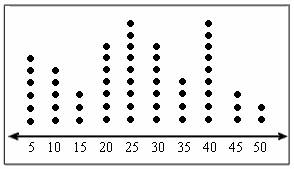
A dot plot is as shown in the figure.
The frequency of the data points is represented by the dots.
Video Examples: MS 7 Math Comparing Box Plots
Solved Example on Dot Plot
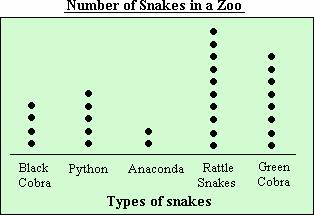
Ques: The number of various kinds of snakes found in a zoo is shown in the dot plot. What is the total number of snakes in the zoo?
Choices:
A. 29
B. 25
C. 30
D. 34
Correct Answer: A
Solution:
Step 1: The number of snakes of a particular kind in the zoo is indicated by the number of dots above the name of the snake in the dot plot.
Step 2: From the plot, the number of Black cobras, Pythons, Anacondas, Rattlesnakes and Green cobras in the zoo are 4, 5, 2, 10 and 8 respectively. [Count the number of dots over each snake name.]
Step 3: The total number of snakes in the zoo = 4 + 5 + 2 + 10 + 8 = 29 [Add the number of snakes of each kind.]
Step 4: So, there are a total of 29 snakes in the zoo.
Quick Summary
- A dot plot uses dots to represent data points on a number line.
- The number of dots above a value indicates how many times that value appears in the data.
- Dot plots help visualize the distribution of data and identify patterns.
🍎 Teacher Insights
Encourage students to create their own dot plots from simple data sets to reinforce the concept. Emphasize the visual representation of frequency.🎓 Prerequisites
- Counting
- Number line
- Data Representation
Check Your Knowledge
Q1: Which of the following is best represented using a Dot Plot?
Q2: In a dot plot, what does the number of dots above a value represent?
Frequently Asked Questions
Q: What is a dot plot used for?
A: Dot plots are used to display the distribution of a small set of data and identify clusters, gaps, and outliers.
Q: How do you create a dot plot?
A: Draw a number line, place a dot above each number representing the data, and stack the dots vertically for repeated numbers.