DIVIDED BAR GRAPH
Definition Of Divided Bar Graph
In a Divided Bar Graph, a bar is divided into several segments to represent a set of quantities according to the different proportions of the total amount.
More About Divided Bar Graph
The concept of divided bar graph is similar to that of a pie chart.
A divided bar graph can be either horizontal or vertical.
Example of Divided Bar Graph
The following divided bar graph shows the percentage of men, women, and children who visited a zoological park out of the total people.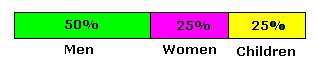
Green color indicates the percentage of men who visited the park; pink color indicates the percentage of women; and yellow color indicates the percentage of children.
Video Examples: Bar Graphs - MathHelp.com- Pre Algebra Help
Solved Example on Divided Bar Graph
Ques: The population of a city (in percent) is shown in the table.
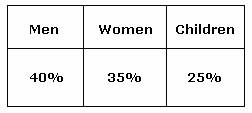
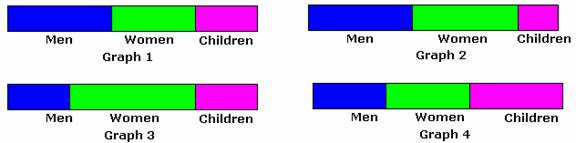
Which of the divided bar graphs represents the given table?
Choices:
A. Graph 1
B. Graph 2
C. Graph 3
D. Graph 4
Correct Answer: A
Solution:
Step 1: In Graph 1, the blue color shows the percentage of men approximately 40%; the green color shows the percentage of women approximately 35%; and the pink color shows the percentage of children approximately 25%.
Step 2: Hence, Graph 1 suitably represents the data given in the table.
Quick Summary
- A divided bar graph represents parts of a whole within a single bar.
- The length of each segment corresponds to its proportion of the total.
- Divided bar graphs can be oriented horizontally or vertically.
- They are similar in concept to pie charts, but use bars instead of circles.
🍎 Teacher Insights
Use real-world examples that are relatable to students, such as classroom demographics or survey results, to illustrate the usefulness of divided bar graphs. Emphasize the connection between fractions, percentages, and the segment lengths. Have students create their own divided bar graphs from given datasets.🎓 Prerequisites
- Basic arithmetic
- Understanding of percentages
- Reading bar graphs
Check Your Knowledge
Q1: A divided bar graph shows the types of pets in a class. 50% are dogs, 30% are cats, and 20% are other pets. If the bar is 10 cm long, how long is the segment representing cats?
Q2: Which of the following is best represented by a divided bar graph?
Frequently Asked Questions
Q: How is a divided bar graph different from a regular bar graph?
A: A regular bar graph displays independent quantities for different categories, while a divided bar graph shows how a single quantity is divided into different parts.
Q: Can a divided bar graph show changes over time?
A: While possible to show the *overall* change in the full bar's size, divided bar graphs are best for representing proportions at a *specific* time. Regular bar graphs are better for showing trends.