CARROLL DIAGRAM
Definition Of Carroll Diagram
A Carroll Diagram is a diagram used to sort objects and numbers, based on certain properties.
More About Carroll Diagram
Carroll diagram is named after famous author Lewis Carroll (alias name of Charles Lutwidge Dodgson).
Example of Carroll Diagram
By using the attributes Prime and Not prime, the numbers 1, 2, 3, 4, 5, 6, 7, 8, 9 can be represented by Carroll diagram as:

Video Examples: MATH TUTORIAL VENN AND CARROLL DIAGRAMS
Solved Example on Carroll Diagram
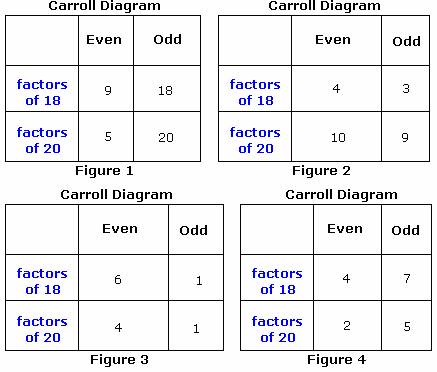
Ques: Identify the Carroll diagram for the factors of 18 and 20 with the attributes as �even� and �odd�.
Choices:
A. Figure 1
B. Figure 2
C. Figure 3
D. Figure 4
Correct Answer: C
Solution:
Step 1: Write the factors for each number.
18: 1, 2, 3, 6, 9, 18
20: 1, 2, 4, 5, 10, 20
Step 2: The factors of 18 with attribute 'even' is 2, 6, and 18.
Step 3: The factors of 18 with attribute 'odd' is 1, 3, and 9.
Step 4: The factors of 20 with attribute 'even' is 2, 4, 10, and 20.
Step 5: The factors of 20 with attribute 'odd' is 1 and 5.
Step 6: The 'even' and 'odd' attributes are correctly given in Figure 3.
Step 7: So, Figure 3 is the Carroll diagram for the factors of 18 and 20.
Quick Summary
- Carroll diagrams help organize data based on 'yes' or 'no' attributes.
- They provide a visual way to categorize items based on whether they possess specific characteristics.
🍎 Teacher Insights
Start with simple, easily identifiable properties to introduce the concept. Use real-world objects to make the diagram more engaging.🎓 Prerequisites
- Basic understanding of properties of objects and numbers
- Ability to classify objects based on given criteria
Check Your Knowledge
Q1: Which of the following numbers is a prime number?
Q2: Which of the following numbers is an even number?
Frequently Asked Questions
Q: What is the purpose of a Carroll Diagram?
A: To sort objects and numbers according to whether they have specific properties.
Q: How is a Carroll Diagram different from a Venn Diagram?
A: A Carroll Diagram sorts items based on 'yes' or 'no' attributes, while a Venn Diagram shows relationships and overlaps between different sets.