LINEAR FUNCTION
Definition Of Linear Function
A function that can be graphically represented in the Cartesian coordinate plane by a straight line is called a Linear Function.
More About Linear Function
A linear function is a first degree polynomial of the form, F(x) = m x + c, where m and c are constants and x is a real variable.
The constant m is called slope and c is called y-intercept.
Example of Linear Function
y = 3x + 5 is a linear function.
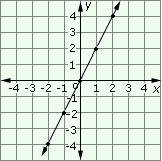
The graph of the function y = 2x is shown below. This is a linear function since the points fit onto a straight line
Video Examples: Graphing Linear Functions by Finding X,Y Intercept
Solved Example on Linear Function
Ques: Identify the graph that represents a linear function.
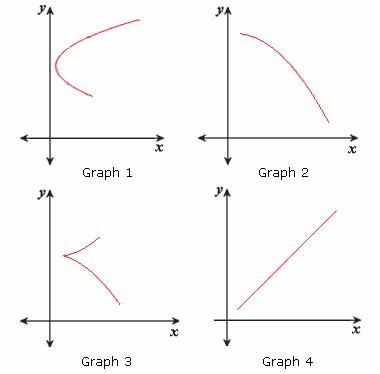
Choices:
A. Graph 1
B. Graph 3
C. Graph 4
D. Graph 2
Correct Answer: C
Solution:
Step 1: The graph of a linear function is a straight line.
Step 2: Graph 4 is a straight line.
Step 3: So, Graph 4 represents a linear function.
Quick Summary
- A linear function is a first-degree polynomial.
- It can be expressed in the form F(x) = mx + c, where m is the slope and c is the y-intercept.
- The graph of a linear function is a straight line.
⚠️ Common Mistakes
- Confusing slope and y-intercept.
- Assuming all functions are linear.
- Incorrectly plotting points on the coordinate plane.
🌍 Real-World Uses
- Calculating the cost of a taxi ride, where the initial fee is 'c' and the cost per mile is 'm'.
- Modeling the depreciation of an asset over time, assuming a constant rate of depreciation.
- Converting temperature from Celsius to Fahrenheit using the formula F = (9/5)C + 32.
📋 Standards Alignment
CCSS.MATH.HSF.LE.A.1CCSS.MATH.HSF.IF.C.7
🔗 Related Links
🍎 Teacher Insights
Use real-world examples to illustrate linear functions, such as distance vs. time or cost vs. quantity. Emphasize the relationship between the equation, graph, and table of values.🎓 Prerequisites
- Basic Algebra
- Coordinate Plane
- Slope
Check Your Knowledge
Q1: Which of the following equations represents a linear function?
Q2: What is the slope of the linear function y = 5x - 2?
Frequently Asked Questions
Q: What is the slope of a linear function?
A: The slope (m) represents the rate of change of the function. It indicates how much the y-value changes for every unit change in the x-value.
Q: What is the y-intercept of a linear function?
A: The y-intercept (c) is the point where the line crosses the y-axis. It is the value of y when x is 0.