Solved Examples and Worksheet for Solving and Graphing Linear Inequalities on a Number Line
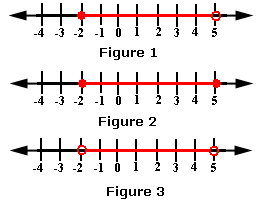
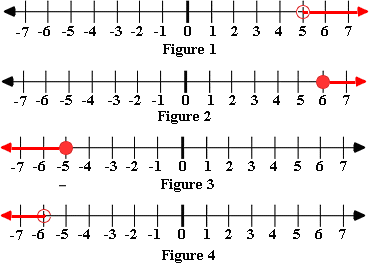
A. Figure 2
B. Figure 3
C. Figure 1
D. All the figures
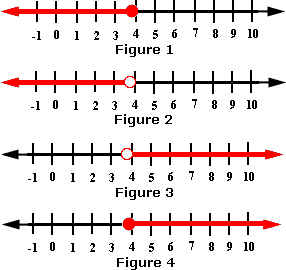
Step: 1
-5 ≤ x
[Original inequality.]
Step: 2
-5 + 3 ≤ x
[Add 3 to each ex
Step: 3
-2 ≤ x
[Simplify.]
Step: 4
The solution is all real numbers greater than or equal to -2 and less than or equal to 5. The graph for the solution is
Correct Answer is : Figure 2
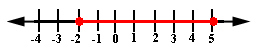
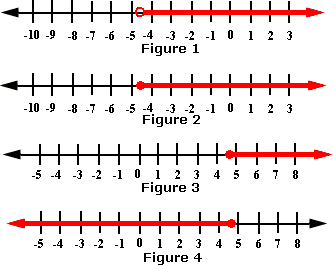
A. Figure 1
B. Figure 2
C. Figure 3
D. None of the above
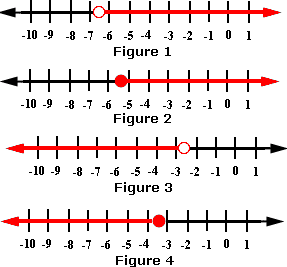
Step: 1
-4 ≤ x x
[Write the inequality as two inequalities.]
Step: 2
-4 + 6 ≤ x x
[Add 6 to each side.]
Step: 3
2 ≤ x x
[Simplify.]
Step: 4
2 ≤ x
[Write compound inequality]
Step: 5
The solution is all real numbers greater than 2 and less than or equal to 9. The graph of the solution can be represented as shown below.
[The red colored region is the solution of the problem.]
Correct Answer is : Figure 1
A. Figure 1
B. Figure 2
C. Figure 3
D. Figure 4
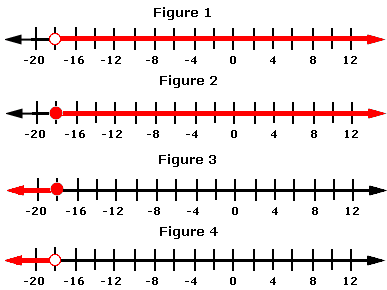
Step: 1
- 5.5 + x
[Original inequality.]
Step: 2
- 5.5 + x
[Add 5.5 to each side.]
Step: 3
[Simplify.]
Step: 4
The solution for the inequality is the set of all real numbers less than 3.9.
Step: 5
So, among the choices, Figure 2 is the appropriate graph for the inequality.
[The set of numbers to the left of 3.9 is the solution for the inequality.]
Correct Answer is : Figure 2
A. Figure 1
B. Figure 2
C. Figure 3
D. Figure 4
Step: 1
- 2.4 + x
[Original inequality.]
Step: 2
- 2.4 + x
[Add 2.4 to each side.]
Step: 3
[Simplify.]
Step: 4
The solution for the inequality is set of all real numbers less than or equal to - 3.4.
Step: 5
Among the choices, Figure 4 satisfies the inequality.
Correct Answer is : Figure 4
A. Figure 1
B. Figure 2
C. Figure 3
D. Figure 4
Step: 1
[Original inequality.]
Step: 2
(6) (x 6
[Multiply each side by 6.]
Step: 3
[Simplify.]
Step: 4
The solution of the inequality includes the set of all the integers less than - 18.
Step: 5
- 18 is not included in the solution, which is represented by an open dot.
Step: 6
The region to the left of - 18 is the solution of the inequality.
[All the numbers to the left of a number are less than the number.]
Step: 7
So, the graph in figure 4 represents the inequality.
Correct Answer is : Figure 4
A. Graph 1
B. Graph 2
C. Graph 3
D. Graph 4
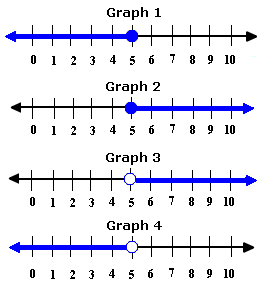
Step: 1
[Original inequality.]
Step: 2
[Subtract 6 from each side.]
Step: 3
[Simplify.]
Step: 4
The solution of the inequality is all real numbers greater than or equal to 5.
Step: 5
From the choice, graph 2 represents the inequality n
Correct Answer is : Graph 2
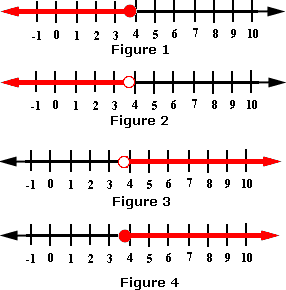
A. Figure 1
B. Figure 2
C. Figure 3
D. Figure 4
Step: 1
[Original inequality.]
Step: 2
(9) (x 9
[Multiply each side by 9.]
Step: 3
[Simplify.]
Step: 4
The solution of the inequality includes the set of all the integers greater than - 18.
Step: 5
- 18 is not included in the solution, which is represented by an open dot.
Step: 6
The region to the right of - 18 is the solution of the inequality.
[All the numbers to the right of a number are greater than the number.]
Step: 7
So, the graph in Figure 1 represents the inequality.
Correct Answer is : Figure 1
A. Figure 1
B. Figure 2
C. Figure 4
D. Figure 3
Step: 1
The solution is all real numbers greater than or equal to - 3 and less than 5. The graph for the solution is:
Step: 2
So, among the choices Figure 1 is the correct choice.
Correct Answer is : Figure 1
- 6.8 +
A. Figure 1
B. Figure 2
C. Figure 3
D. Figure 4
Step: 1
- 6.8 + x
[Original inequality.]
Step: 2
- 6.8 + x
[Add 6.8 to each side.]
Step: 3
[Simplify.]
Step: 4
The solution for the inequality is the set of all real numbers greater than 3.9.
Step: 5
So, among the choices, Figure 3 is the appropriate graph for the inequality.
[The set of numbers to the right of 3.9 is the solution for the inequality.]
Correct Answer is : Figure 3
A. Figure 3
B. Figure 1
C. Figure 4
D. Figure 2
Step: 1
The solution of the inequality includes the set of all the integers less than -18.
Step: 2
The region to the left of -18 is the solution of the inequality.
[All the numbers to the right of a number are greater than the number.]
Step: 3
So, the number line in Figure 4 represents the inequality.
Correct Answer is : Figure 4
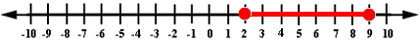
A. Figure 3
B. Figure 4
C. Figure 1
D. Figure 2
Step: 1
2x
[Original inequality.]
Step: 2
[Divide each side by 2.]
Step: 3
[Simplify.]
Step: 4
The inequality x
Step: 5
The inequalities, ≥ or ≤ are represented with closed dot on number line.
Step: 6
The following figure represents the solutions of the inequality.

Correct Answer is : Figure 2
A. Figure 3
B. Figure 1
C. Figure 4
D. Figure 2
Step: 1
3.5 + x
[Original inequality.]
Step: 2
[Combine like terms.]
Step: 3
[Subtract 9.1 from each side.]
Step: 4
[Simplify.]
Step: 5
Among the choices, Figure 2 satisfies the inequality.
Correct Answer is : Figure 2
- 7.7 +
A. Figure 1
B. Figure 3
C. Figure 4
D. Figure 2
Step: 1
- 7.7 + x
Step: 2
- 7.7 + x
[Add 7.7 to both sides of the equation.]
Step: 3
[Simplify.]
Step: 4
The solution for the inequality is the set of all real numbers greater than 3.9.
Step: 5
As x
Step: 6
So, among the choices, Figure 3 is the appropriate graph for the inequality.
[The solution for the inequality is the set of numbers to the right of 3.9.]
Correct Answer is : Figure 3
- Converting Fractions, Decimals and Percents-Gr 7-Solved Examples
- Estimation-Whole Numbers-Gr 7-Solved Examples
- Estimation-Decimals-Gr 7-Solved Examples
- Estimation-Fractions-Gr 7-Solved Examples
- Estimation-Percentages-Gr 7-Solved Examples
- Simplifying Linear Expressions-Gr 7-Solved Examples
- Writing Linear Equations for the Situations-Gr 7-Solved Examples
- Writing Inequalities to Represent the Situations-Gr 7-Solved Examples
- Solving Two-step Linear Equations-Gr 7-Solved Examples
- Applications of Linear Equations-Gr 7-Solved Examples
- Solving Linear Inequalities - Word Problems-Gr 7-Solved Examples
Related Worksheet
- Number Line