TREND
Definition Of Trend
If the values of one set of data increases and the values of other set also increases then the two sets of related data shows a positive trend. If the values of one set of data increases and the values of other set decreases then the two sets of related data shows a negative trend. If the data shows no relation then that set shows no trend.
If the data values of a set increases and the data values of other set also increases then the two sets of related data shows a positive trend. If the data values of one set increases and the data values of other set decreases then the two sets of related data shows a negative trend. If the data shows no relation then that set shows no trend.
More About Trend
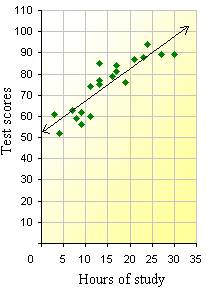
Trend Line - In a scatter plot, a line that closely fits the data points is called a Trend line
If one set of data increases, then the other set tends to decrease then the trend shown is called a negative trend.
If increase in one set of data causes the other set to increase, then the trend shown is called a positive trend.
If one set of data increases, then the other set does not seem to increase or decrease then it does not have any trend.
Video Examples: Trends in International Math and Science Study
Examples on Trend
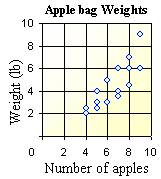
As the number of apples in the bag increases, the weight of the apple bag also tends to increase. So, the scatter plot shows a positive trend.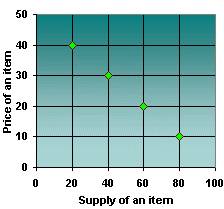 As the supply of an item increases, the price of the item decreases and as the supply decreases, the price of the item increases. So, the scatter plot follows a negative trend.
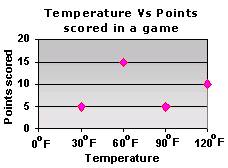 It can be observed that as the temperature increases, the number of points scored in the game tends to increase or decrease without any relationship. So, the scatter plot follows no trend.
Solved Example on Trend
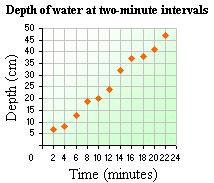
Ques: Describe the trend shown by the scatter plot.
Choices:
A. No trend
B. Positive trend
C. Negative trend
Correct Answer: B
Solution:
Step 1: Each point in the scatter plot denotes the depth of water in the respective two-minute interval
Step 2: As the time in minutes increases, the depth of water in the bathtub tends to increase. So, the scatter plot shows a positive trend.
Quick Summary
- A positive trend means both sets of data increase together.
- A negative trend means as one set of data increases, the other decreases.
- No trend means there is no relationship between the data sets.
- Trends can be visualized using trend lines on scatter plots.
⚠️ Common Mistakes
- Assuming correlation implies causation.
- Misinterpreting a lack of clear trend as an absence of any relationship.
- Drawing trend lines that do not accurately represent the data.
🌍 Real-World Uses
- Analyzing stock market data to identify upward or downward trends in stock prices.
- Tracking sales data over time to determine if sales are increasing, decreasing, or remaining stable.
- Monitoring population growth or decline over several years to understand demographic trends.
📋 Standards Alignment
CCSS.MATH.SP.A.1CCSS.MATH.SP.B.5
🔗 Related Links
🍎 Teacher Insights
Use real-world examples, such as supply and demand or temperature and ice cream sales, to illustrate trends. Encourage students to create their own scatter plots and analyze the trends they observe.🎓 Prerequisites
- Basic understanding of data sets
- Ability to plot points on a graph
- Familiarity with scatter plots
Check Your Knowledge
Q1: Which of the following describes a positive trend?
Q2: In a scatter plot showing the relationship between hours studied and exam scores, a negative trend would suggest:
Frequently Asked Questions
Q: What is a trend line?
A: A trend line is a line on a scatter plot that approximates the relationship between the data points.
Q: How can I identify a trend?
A: Look at how the data points on a scatter plot generally move. Do they tend to increase together, decrease together, or show no pattern?