Linear Inequality
Definition Of Linear Inequality
A Linear Inequality involves a linear expression in two variables by using any of the relational symbols such as <,>, ≤ or ≥
More About Linear Inequality
A linear inequality divides a plane into two parts.
If the boundary line is solid, then the linear inequality must be either ≥ or ≤.
If the boundary line is dotted, then the linear inequality must be either > or <>
Example of Linear Inequality
Video Examples: Solving Linear Inequalities
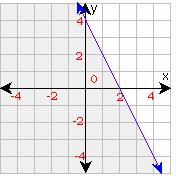
As the boundary line in the above graph is a solid line, the inequality must be either ≥ or ≤.
Since the region below the line is shaded, the inequality should be ≤.
We can notice that the line y = - 2x + 4 is included in the graph; therefore, the inequality is y = - 2x + 4. Any point in the shaded plane is a solution and even the points that fall on the line are also solutions to the inequality.
4x + 6y = 12, x + 6 ≥ 14, 2x - 6y < 12="" +="" 2x,="" 9y="">< 12="" +="" 2x="" are="" the="" examples="" of="" inear="" inequalities.="">
Solved Example on Linear Inequality
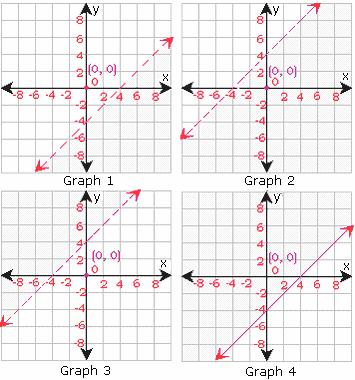
Ques: Which of the graphs best suits the inequality y < x="">< -4="">
Choices:
A. Graph 1
B. Graph 2
C. Graph 3
D. Graph 4
Correct Answer: A
Solution:
Step 1: Since the inequality 'involves less than' (<), use="" dashed="" boundary="" line="" to="" graph="" the="" inequality="" y="">< x="" -="" 4="" as="" in="" the="" below="" shown="" graph="">
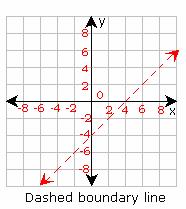
Step 2: Test a point, which is not on the boundary line.
Test (0, 0) in the inequality.
y < x="" -="" 4="">
0 < 0=""><>
0 < -="">
Step 3: Since the inequality is false for (0, 0), shade the region that does not contain (0, 0).
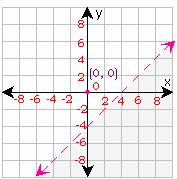
Step 4: Therefore, Graph 1 best suit the inequality y < x="">
- Solving-Linear-Inequalities---Word-Problems-Gr-7