Line Plot
Definition Of Line Plot
A line plot shows data on a number line with x or other marks to show frequency.
Example of Line Plot
The line plot below shows the test scores of 26 students.
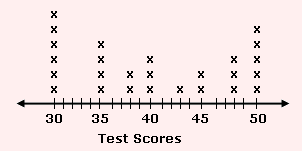
The count of cross marks above each score represents the number of students who obtained the respective score.
Video Examples: Line Plot
Solved Example on Line Plot
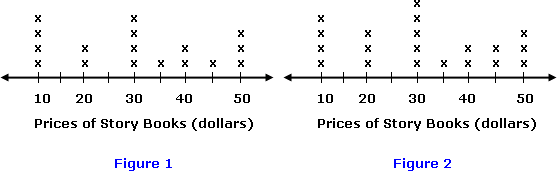
Ques: Which of the line plots represents the prices of different story books given below? $10, $30, $10, $10, $20, $30, $50, $40, $45, $50, $10, $30, $35, $30, $20, $40, $50
Choices:
A. Figure 1
B. Figure 2
Correct Answer: A
Solution:
Step 1: First arrange the data items from least to greatest. $10, $10, $10, $10, $20, $20, $30, $30, $30, $30, $35, $40, $40, $45, $50, $50, $50
Step 2: Now group the data items that are the same.
4 story books cost $10
2 story books cost $20
4 story books cost $30
1 story book costs $35
2 story books cost $40
1 story book costs $45
3 story books cost $50
Step 3: Match the grouped data items with the figures shown. Figure-1 represents the data correctly.